Example
Since it’s difficult to understand how the system works just by looking to the Architecture Diagram, we are going to present a complete example.
- We are going to start by describing how we created the tests based on the observations we want to make.
- Then we are describing how our decisions are written down into configuration files.
- And we are going to end by describing how the test is actually executed within the test driver.
The testing scenario
We have a marathon service that runs on 127.0.0.1:8080 and we want to see how
well the endpoint /v2/groups is responding as the load to the /v2/apps
endpoint increases.
Having read the Concepts we decided that our axis is going to be
the “deployments per second”, so deploymentRate and we are going to explore the
values from 100 to 1000 with an interval of 50.
To make sure that we are operating on a clean slate every time we also agreed that we should wait for the previous deployments to complete before starting the new ones.
In addition, we decided that we are going to measure how long an HTTP request to
the /v2/groups endpoint takes, so our metric is the responseTime in
seconds.
Effectively we want to measure:

Finally, since we will be constantly sampling the groups endpoint we are most
certainly going to collect more than one value for the same test case, so we
are going to use the mean_err summarizer to collect the mean values with
uncertainty information.
Having defined the parameters and the metrics in a conceptual level
we can already write them down in the configuration file.
Since they do not target any particular component they are defined in the global configuration section like so:
config:

  # Test parameters
  parameters:
    - name: deploymentRate
      units: depl/s
      desc: The number of deployments per second

  # Test metrics
  metrics:
    - name: responseTime
      units: sec
      desc: The time for an HTTP request to complete
      summarize: [mean_err]
You can refer to the Global Configuration Statements for more details on what fields you can use and what’s their interpretation.
Note
In the above example, the summarize field is using the compact expression
for a built-in summarizer. The equivalent full representation would be the
following:
- name: responseTime
  ..
  summarize:
    - class: "@mean_err"
The full representation allows you to customize them even further, providing for example a different name (ex. for the plots) or turning off the automatic outliers rejection.
- name: responseTime
  ..
  summarize:
    - class: "@mean_err"
      name: "Mean (With Error)"
      outliers: no
Configuring our black box
According to the The Black Box Abstraction we have to configure the components that are going to apply the changes to marathon and collect the measurements.
Input
We are going to start by implementing the input direction of our black box,
and more specifically we are going to figure out which Channel are we going to
use for applying the changes to marathon.
As we described above we need to make deploymentRate-requests per second.
Browsing through the Channels reference we notice the
HTTPChannel. According to it’s documentation, it
“performs an HTTP request every time a parameter changes”.
We also notice that it accepts a repeat parameter, that is repeating the
same request multiple times.
By copying the fields of interest from the reference and using the correct Macros we compose the following configuration fragment:
channels:
  - class: channel.HTTPChannel
    url: http://127.0.0.1:8080/v2/apps
    verb: POST
    repeat: "{{deploymentRate}}"
    body: |
      {
        "id": "/scale-instances/{{uuid()}}",
        "cmd": "sleep 1200",
        "cpus": 0.1,
        "mem": 64,
        "disk": 0,
        "instances": 0,
        "backoffFactor": 1.0,
        "backoffSeconds": 0
      }
This instantiates a HTTPChannel class that is going to perform an HTTP POST
to the endpoint http://127.0.0.1:8080/v2/apps every time the value of a
macro changes. In our case, the deploymentRate.
In addition, it is going to repeat this request “deploymentRate” times. This means 100 times on the first run, 150 on the second etc. For the sake of the example let’s assume that all 1000 requests will be posted within a second so we don’t have to take any other action for satisfying the “per second” part of the test scenario.
Note
The automatic triggering of the channel when a macro changes is a bit of a “magic” behavior only for the channel configuration. It can be configured using the trigger syntax as described in Channel Triggers.
Output
We are now going to implement the output of our black box. As seen in the
The Black Box Abstraction diagram we need to define an Observer, a Tracker
and a Summarizer. But let’s see in detail what they are about.
From our test scenario, we want to measure “how long an HTTP request to the
/v2/groups endpoint takes”. Thus we need to plug an appropriate component
to perform this request.
We know from the documentation that the components that makes observations to the application being tested are the Observers. By looking on the Observers reference page we find out that the HTTPTimingObserver is particularly useful in our case.
We start by copying the example from the documentation page, removing the fields we don’t need and modifying the values according to our needs
observers:
  - class: observer.HTTPTimingObserver
    url: http://127.0.0.1:8080/v2/groups
    interval: 1
That’s it. Now while our tests are running the HTTPTimingObserver is going
to poll the /v2/groups endpoint every second. Looking into the Event Reference
we see that this observer broadcasts the HTTPTimingResultEvent when a
measurement is completed.
Next, we have to define a Tracker that is going to convert the observed
events into measurements. In our case we just need to extract the fields of
interest from the HTTPTimingResultEvent event. Again, by looking to
the Trackers reference we see that
EventAttributeTracker is what we need.
Again, we copy the example and adjust the values to our needs:
trackers:
  - class: tracker.EventAttributeTracker
    event: HTTPTimingResultEvent
    extract:
      - metric: responseTime
        attrib: responseTime
Note
This might be a bit difficult to digest at a first glimpse, but it’s quite easy after you understand what it does:
- It waits until a
HTTPTimingResultEventis dispatched in the bus - It extracts the
responseTimeattribute from the event - It stores it as a value for the
responseTimemetric that we defined on the first step.
Note
Not all events have fields. However for the ones that have, the Event Reference listing contains everything you will need to know.
Finally, you will notice that we have already defined our Summarizer when we defined the metric on the first step. It’s configuration belongs on the global section because it’s annotating the metric.
Having our black box defined we are going to continue with defining the parameter evolution policy on the next step.
Defining the axis evolution
As we previously mentioned, we want the deploymentRate to increase gradually
from 100 to 1000 with an interval of 50. But when are we advancing to the next?
Answering this question will help us pick the policy are we going to use. In principle we will need to read the Policies class reference and pick the most fitting policy for our case, but briefly we could say:
- Do we advance to the next value at fixed time intervals (ex. every minute)? Then we are going to use a TimeEvolutionPolicy.
- Do we advance to the next value when a well-described case is met? Then we are going to use the MultiStepPolicy.
In our case we don’t want to overload the system, so we cannot use fixed timed intervals since an operation might take longer than expected. So we are going to use the MultiStepPolicy.
Note
We are choosing MultiStepPolicy in favor of MultivariableExplorerPolicy, even though they are very close on their features, because the former exposes a more elaborate configuration.
Now let’s answer the other question: Which is the “well-described” case that should be met before advancing to the next value?
In our example we are going to wait until all the deployments have completed. To achieve this we are going to wait until the correct number of the appropriate events is received.
Let’s start first by copying the example configuration from the
MultiStepPolicy and let’s keep only the steps section for now. We are
going to keep only one step. Following the examples, we are using the
min/max/step configuration for the deploymentRate.
policies:
  - class: policy.MultiStepPolicy
    steps:

      # Explore deploymentRate from 100 to 1000 with interval 50
      - name: Stress-Testing Marathon
        values:
          - parameter: deploymentRate
            min: 100
            max : 1000
            step: 50
Technically, our policy is now syntactically correct. However, if you try to run it you will notice that it will scan full range of options as fast as possible. That’s not what we want.
We notice on the MultiStepPolicy documentation the events section, and
in particular the events.advance event. That’s exactly what we want, but
what event are we going to to listen for?
Let’s consider what components do we currently have that are broadcasting events:
- We have an
HTTPChannelthat broadcasts HTTP life cycle events, such asHTTPRequestStartEvent,HTTPRequestEndEvent,HTTPResponseStartEventandHTTPResponseEndEvent– Not interesting. - We have an
HTTPTimingObserverthat broadcasts the measurementHTTPTimingResultEventevent – Not interesting. - We have the
MultiStepPolicythat broadcasts theParameterUpdatedEvent– Not interesting.
- So it looks that we are going to need a new observer. Going back to the
Observers we notice the MarathonPollerObserver. From it’s documentation we see that it subscribes to the marathon SSE event stream and brings in the marathon events. More specifically, the
MarathonDeploymentSuccessEventthat we need. That’s perfect!Again, we copy the example from the documentation and we adjust to our needs
observers:
 ...

 - class: observer.MarathonPollerObserver
   url: "http://127.0.0.1:8080"
Now that we have our observer in place, let’s go back to our policy configuration
and let’s add an events section with an advance field, pointing to the
MarathonDeploymentSuccessEvent event:
policies:
  - class: policy.MultiStepPolicy
    steps:

      # Explore deploymentRate from 100 to 1000 with interval 50
      - name: Stress-Testing Marathon
        values:
          - parameter: deploymentRate
            min: 100
            max : 1000
            step: 50

        # Advance when the deployment is successful
        events:
          advance: MarathonDeploymentSuccessEvent:notrace
Note the :notrace suffix of the event. We are using an
Event Filters syntax to instruct the policy to ignore
tracing due to Event Cascading, since the policy does not
have enough information to trace the MarathonDeploymentSuccessEvent and
all these events will be ignored.
Note
You may wonder when you should use :notrace and when not. In principle you
should always check the component documentation if the events it emits are
properly cascaded and which are the event(s) they require in order to properly
trace it. If you are properly using them you should never have to use :notrace.
However there are also cases where the events you are waiting for do not
belong on a trace. For example, the TickEvent is sent 30 times per second,
but it does not belong on a trace. Therefore if we don’t use :notrace all
of them will be filtered out.
In our particular case, the MarathonPollerObserver
requires the deployments to be started using a
MarathonDeployChannel or a
MarathonUpdateChannel, since it is listening for
MarathonDeploymentRequestedEvent events in order to extract the ID of the
app/pod/group being deployed and link it to the appropriate status update
event.
If you test the policy now you will notice that it’s indeed waiting for the first deployment success event to arrive, but this is again not what we need.
We should wait until all the requests from the current test cases are handled.
Effectively this means waiting for deploymentRate number of events. This can
be easily defined using the advance_condition section and the events
section:
policies:
  - class: policy.MultiStepPolicy
    steps:

      # Explore deploymentRate from 100 to 1000 with interval 50
      - name: Stress-Testing Marathon
        values:
          - parameter: deploymentRate
            min: 100
            max : 1000
            step: 50

        # Advance when the deployment is successful
        events:
          advance: MarathonDeploymentSuccessEvent

        # Advance only when we have received <deploymentRate> events
        advance_condition:
          events: "deploymentRate"
Note
You might wonder why we are not using the macro {deploymentRate} but we
rather used the literal deploymentRate?
That’s because according to the documentation this value can be any valid python expression where the parameter values and the already existing definitions are available in the globals.
This allows you to have more elaborate advance conditions, such as:
deploymentRate / 3 or 2 * deploymentRate.
Ensuring state integrity
If we try to mentally process the series of actions that are going to be taken when the tests are running, you will notice that each test case is deploying some apps but they are never removed.
This means that we do not operate always on a clean marathon state. To mitigate
this we need to invoke an one-time action in between the tests. These actions
are called tasks and you can find a list of them in the Tasks
reference.
We notice that the marathon.RemoveGroup task can come in handy,
since we are deploying apps inside the same group. We also read on the table
on the top of the page that we should trigger this task between the value
changes. So we should register the task on the intertest trigger.
Again, we copy the example configuration and we modify it to our needs:
tasks:
  - class: tasks.marathon.RemoveGroup
    at: intertest
    url: "http://127.0.0.1:8080"
    group: "/scale-instances"
Note
Note that with the MultiStepPolicy you can also
customize further when some triggers are called. For example, if you want
the RemoveGroup task to be executed Before each time the value is
changed (the default is After), you can use the respective tasks section
on it’s configuration:
policies:
  - class: policy.MultiStepPolicy
    steps:

      # Explore deploymentRate from 100 to 1000 with interval 50
      - name: Stress-Testing Marathon
        ...

        # Fire "prevalue" trigger before changing the value
        tasks:
          pre_value: prevalue

tasks:

  # Register the RemoveGroup to be triggered on "prevalue"
  - class: tasks.marathon.RemoveGroup
    at: prevalue
    url: "http://127.0.0.1:8080"
    group: "scale-instances"
Reporting the results
Now that we have completed the test configuration it’s time to describe how and where the results will be collected.
The test driver has a variety of reporters that we can choose from. You can see all of them in the Reporters reference. However there is a handful that you are going frequently use. These are the reporters that we are going to plug in our example.
Plots
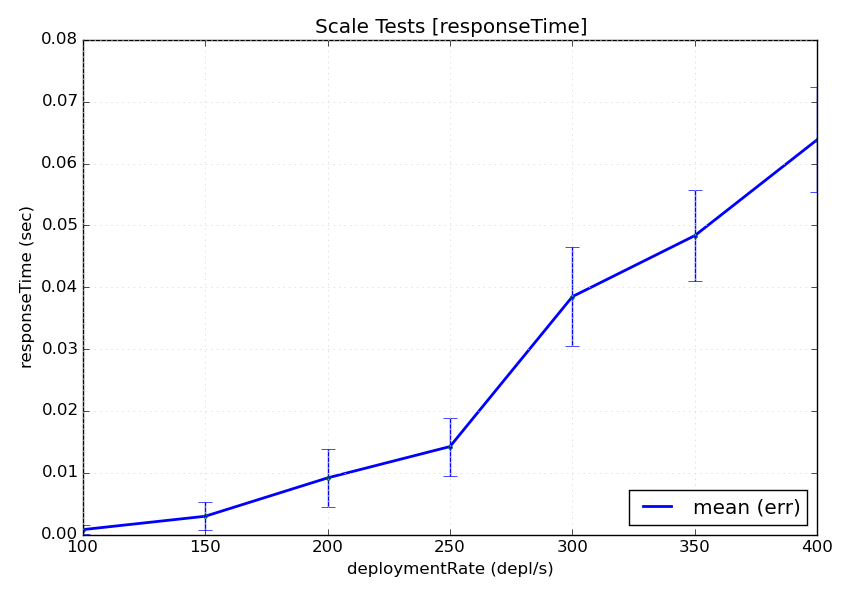
First of all, we are interested into getting some visual feedback with the results. The test driver provides a PlotReporter that can be used in this scenario.
This reporter visualizes the Summarized results on a plot where the axis is the test parameters and the values are the measured results. An image will be generated for every metric in the configuration.
We noticed that all the parameters of the plot reporter are optional so we are not going to include any. This is as simple as:
reporters:
  - class: reporter.PlotReporter
This would yield a plot-responseTime.png file that looks like this:
Note
The plot reporter can also visualize data in two axes. In this case a 2D plot would be used instead.
Note
The plot reporter will not function with more than two axes. That’s because it’s not possible to visualize more than two-dimensional data on a static image.
Machine-Readable Data
Of course plots are easy to read, but usually you would need the data to be available in a machine-processable format. You can choose between two options:
- The CSVReporter produces a comma-separated-values (CSV) file with the parameter values and the summarized results
- The RawReporter produces a detailed JSON dump that includes everything that you would need for processing or reproducing the tests.
Since we want to be verbose, we are going to plug a RawReporter:
reporters:
  - class: reporter.RawReporter
    filename: "results-raw.json"
Note
Having the results collected in a raw dump you can later use the
dcos-compare-tool to compare runs.
Indicators
Let’s say that you are running this performance test in a CI environment and you want to see the evolution of the measurements over time. What data would you submit to a time-series database?
Submitting the entire plot for every run is rather unhelpful, since you will end up with too many data and you will need to come up with an elaborate data summarization during post-processing.
Instead, you can pre-calculate a summarized value from all the observations of every metric. You can achieve this using the Indicators.
An indicator receives both metrics and parameters for every test case and calculates a single scalar value that that carries some meaningful information from the entire run.
A frequently used one is the NormalizedMeanMetricIndicator. This indicator normalizes the summarized value of every test case and calculates the mean of all these values.
You could say that for every value of axis_1 and every respective measurement
of metric_1, summarized using the sum_1 summarizer (ex. mean_err),
the indicator can be expressed as:
![indicator =
\frac{1}{n} \cdot
\sum_{axis_{1} = [...]}^{n}\left (
\frac{ \sum_{sum_{1}} f_{metric_{1}}(axis_{1}) }{ axis_{1} }
\right )](../_images/math/73560b19aba4b820e049b90592e5e2bfdaaef299.png)
In our example, we would like to know what’s the average time it took for every instance to be deployed. For this, we are going to calculate:
- The mean value of every deployment measurement (as we already do above)
- Then divide it (aka normalize it) by the number of apps being deployed
- Then calculate the mean of all the above measurements
This can be achieved using the
NormalizedMeanMetricIndicator like so. Note that just
like parameters and metrics, the indicators belong on the global
configuration:
config:
  ...
  indicators:
    # Calculate `meanResponseTime` by calculating the normalizing average
    # of all the `responseTime` mean values, normalized against the current
    # deploymentRate
    - name: meanResponseTime
      class: indicator.NormalizedMeanMetricIndicator
      metric: responseTime.mean_err
      normalizeto: deploymentRate
Increasing our statistics
Finally, like with every statistical problem, you will most probably need to repeat your tests until you have enough statistics.
This can be easily configured with the repeat parameter in the global
configuration section:
config:

  # Repeat this test 5 times
  repeat: 5
Parameterizing your configuration
You might notice that we are frequently repeating the base marathon URL
http://127.0.0.1:8080. To avoid this repetition we could use Macros.
A macro is an expression contained in double brackets, such as
{{marathon_url}}. At run-time this macro would be replaced with the contents
of the Definition with the same name. For example we can change our observers
like so:
observers:

  # Replace http://127.0.0.1:8080 with {{marathon_url}}
  - class: observer.HTTPTimingObserver
    url: {{marathon_url}}/v2/groups
    interval: 1

  # Also replace http://127.0.0.1:8080 with {{marathon_url}}
  - class: observer.MarathonPollerObserver
    url: "{{marathon_url}}"
The value for the macro can either be defined using a define statement like so:
define:
  marathon_url: http://127.0.0.1:8080
Or provided by the command-line, like so:
~$ dcos-perf-test-driver -Dmarathon_url=http://127.0.0.1:8080
Note
Even though it is possible to use the above command-line as-is, it’s recommended to use the config.definitions section to define which definitions can be provided from the command line.
For example, using:
config:
  ...
  definitions:
    - name: marathon_url
      desc: The URL to marathon to use
      required: yes
This way, if the user does not provide the marathon_url definition, the
driver will exit with an error, instructing the user to provide a value
instead of silently ignoring it.
Running the tests
By now your configuration file should look something like the one found in the Configuration Example.
Assuming that you have saved it under the name scale-tests.yml you can launch
it like so:
~$ dcos-perf-test-driver ./scale-tests.yml
If you observe a behaviour that you don’t expect, you can also run the driver in verbose mode. In this mode you will also see the verbose, debug messages that could be helpful to troubleshoot some problems:
~$ dcos-perf-test-driver --verbose ./scale-tests.yml
Check the Usage section for more details on the command-line