Architecture
The DC/OS Performance Test Driver is design to be modular and extensible in order to adapt to the needs of every interested party.
It is composed of a set of individual components that all plug on a shared event bus and communicate to each other purely through messages.
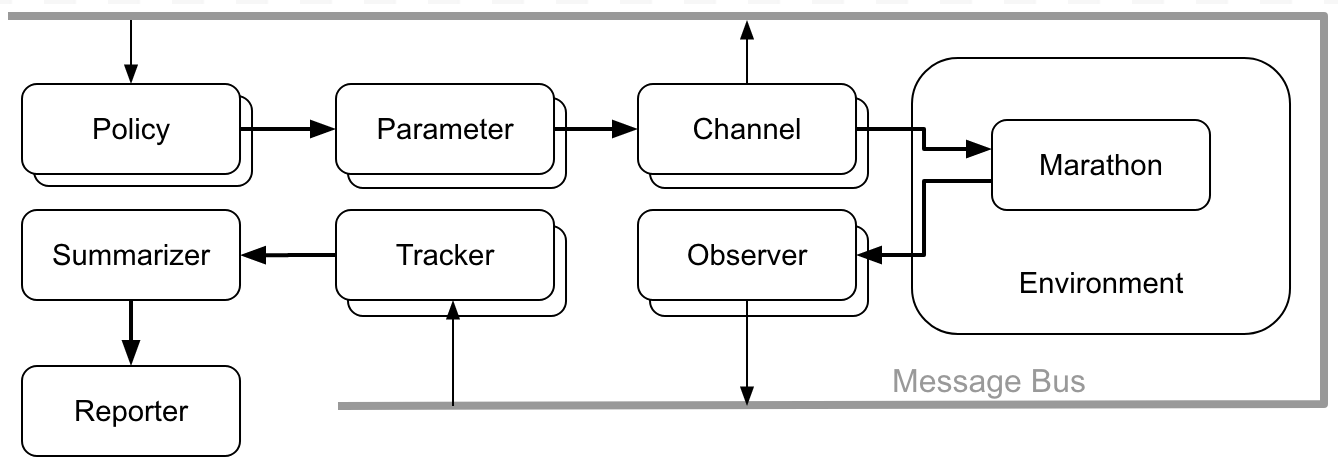
According to their main function they are separated in the following types:
- A Policy controls the evolution of the test
- A Channel applies the changes that occurred to the parameters by the policy to the application being tested
- An Observer monitors the application being tested and broadcasts useful events to the event bus
- A Tracker is listening for events in the event bus and extracts or calculates useful values from them
- A Summarizer collects the values calculated by the tracker, groups them by test case and calculates the min/max/average or other summarization values
You may want to read the Concepts section on the reasoning behind this separation or the Example section to see how they work in action.
Instantiating Components
Since there are no cross-component dependencies they can be instantiated and plugged into the bus when needed. Only a static argument configuration would be required that is going to configure it’s behavior.
If we were to write it in a python code we would have written something like so:
bus.plug(
  HttpChannel(
    url="http://127.0.0.1:8080/some/api",
    method="POST",
    body='{"hello": "rest"}'
  )
)
But since all the components are instantiated in the same way we can can completely avoid using code and express the same thing in a YAML block like so:
- class: HttpChannel
  url: http://127.0.0.1:8080/some/api
  method: POST
  body: |
    {
      "hello": "rest"
    }
That’s why the DC/OS Performance Test Driver is using YAML files for it’s configuration.
Event Cascading
Since everything in the DC/OS Performance Test Driver is orchestrated through messages it’s important to identify the test case each event belogs into. For this reason the driver is using Event Cascading as the means to describe which event was emitted as a response to another.
Take the following diagram for example:
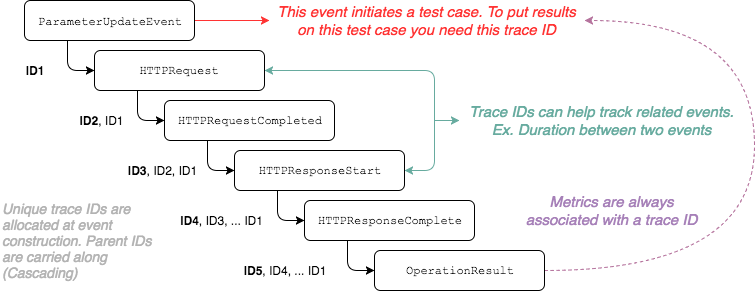
The Event Cascading is implemented by assigning unique IDs (called
traceids) to every event and carrying the related event IDs along when an
event is emitted as a response (or in relation) to another.
Usually, the root event is the ParameterUpdateEvent that is emitted when a
test case is initiated and the parameter values are defined. Every other event
that takes place in the test is carrying this ID.
Warning
If you are seeing unexpected results or behaviors it’s most probable that you have not taken into account the event tracing.
Important
If you are a component developer you should always carry along the correct traceids when you are publishing events. As a rule of thumb you should take care of the following two cases:
- Actions that are triggered by an event should always publish events that carry along the traceids from the originating event.
- Actions that are not part of an event chain should publish events that carry
along the traceids from the latest
ParameterUpateEventobserved.
Processing the metrics
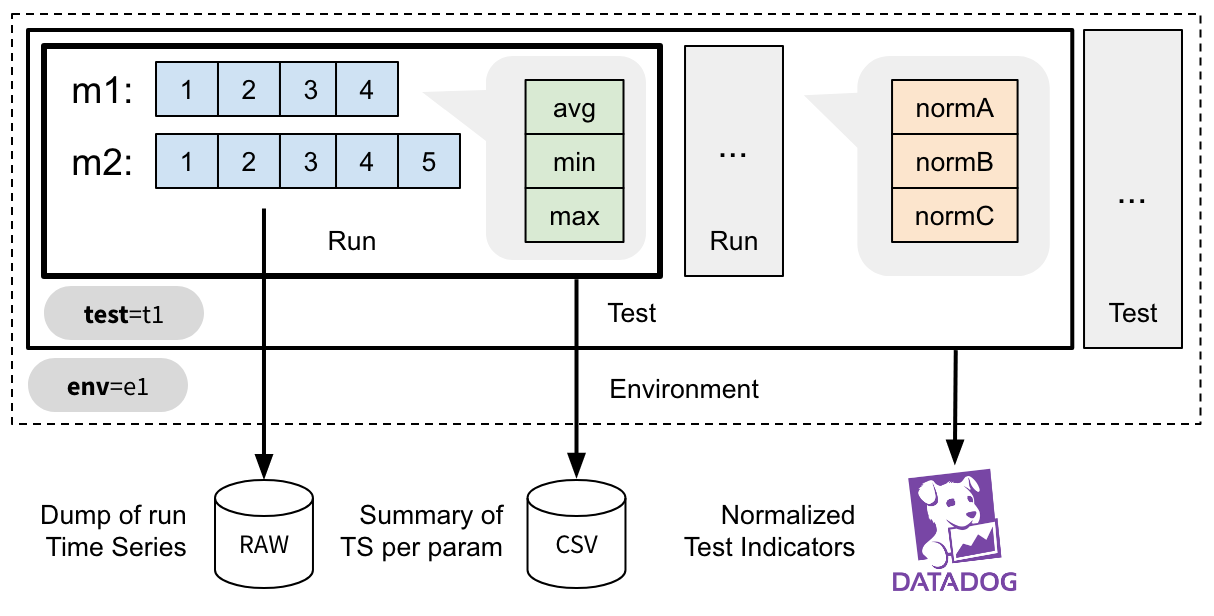
In dcos-perf-test-driver the metric values are produced by the Trackers and archived the moment they are emmmited and archived into an array of time series values.
Test Phase
In dcos-perf-test-driver the performance tests are executed for each parameter combination in question and are repeated for one or more times in order to increase the statistics.
Each time the actual performance test is executed, a Test Phase is initiated.
Timeseries
For every phase one or more metrics are being collected. The moment a metric is sampled it’s placed in an in-memory time-series record.
This record is unique for the every parameter combination, effectively creating an Axis - Values representation.
These time series are further summarised or post-processed according to the needs of the reporter.
Summarized Values
When a phase is completed, the timeseries values are summarised using one or more summarisers, as defined in the config.metrics configuration parameter.
Calculating the summarised values makes the results visualizable. For instance, you can pick a metric and a parameter and easily create an 1D plot with the data.
Indicators
The indicators scalar values that describe the overall outcome of the test as a single number. They are useful to detect deviations from the previous results and to raise alerts.
For instance, you can normalize the value of the time each marathon deployment takes against the number of applications you instructed to scale to, thus creating the meanDeploymentTimePerApp indicator.